The UK Pension Landscape
See how UK pension pots differ, depending on region, age and gender
How does the average pension pot in your region compare to the rest of the nation?
The UK average

£21,875
Average pension pot size

41%
Proportion who've contributed
Greater London

.webp)
* Source: PensionBee, July 2025. Total sample size of the UK Pension Landscape is 285,287 customers as at 30 June 2025.
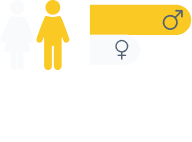
The gender pension gap
Our research revealed a 37% gap between male and female pension pots. See the gap broken down from region to region, and discover the impact gender can have on your pension.
United Kingdom
United Kingdom

Male £25,652
Female £16,169
North East

Male £21,143
Female £12,843
North West

Male £20,206
Female £12,043
East Midlands

Male £23,250
Female £13,463
West Midlands
Male £22,967
Female £13,240
South East

Male £32,787
Female £20,415
South West
Male £25,543
Female £15,448
Greater London

Male £29,488
Female £20,921
Scotland
Male £22,907
Female £13,232
Northern Ireland

Male £17,855
Female £10,221
Wales
Male £20,826
Female £11,836
The average pension pot by age
Age has significant impact on the gender pension gap, with inequality increasing as women get older. By the time women reach their 50s, men have a pot that’s almost twice the size.
Under 30
years old


13%
Gender Gap
£3,481
Average female pot
£4,009
Average male pot
£181,165
We have assumed the pension grows at an annual rate of 5% and that, based on our default plan, Global Leaders, annual charges are 0.70%. Average monthly contributions are based on the minimum required contribution of 8% of qualifying earnings for Auto-Enrolment. Average salaries are taken from HMRC’s national statistics on the distribution of income, and it is assumed that individuals will receive a 2% salary increase per year. Inflation reduces the rate of return. All calculations are based on the average age for the entire group, and it is assumed that the retirement age is 66.

Average pension pot size at 66

7%
Have invested in a responsible plan
30 - 39
years old


20%
Gender Gap
£9,451
Average female pot
£11,870
Average male pot
£178,439
We have assumed the pension grows at an annual rate of 5% and that, based on our default plan, Global Leaders, annual charges are 0.70%. Average monthly contributions are based on the minimum required contribution of 8% of qualifying earnings for Auto-Enrolment. Average salaries are taken from HMRC’s national statistics on the distribution of income, and it is assumed that individuals will receive a 2% salary increase per year. Inflation reduces the rate of return. All calculations are based on the average age for the entire group, and it is assumed that the retirement age is 66.
Average pension pot size at 66
10%
Have invested in a responsible plan
40 - 49
years old

24%
Gender Gap
£20,141
Average female pot
£26,482
Average male pot
£130,140
We have assumed the pension grows at an annual rate of 5% and that, based on our default plan, Global Leaders, annual charges are 0.70%. Average monthly contributions are based on the minimum required contribution of 8% of qualifying earnings for Auto-Enrolment. Average salaries are taken from HMRC’s national statistics on the distribution of income, and it is assumed that individuals will receive a 2% salary increase per year. Inflation reduces the rate of return. All calculations are based on the average age for the entire group, and it is assumed that the retirement age is 66.
Average pension pot size at 66
11%
Have invested in a responsible plan
Over 50
years old


44%
Gender Gap
£30,644
Average female pot
£54,512
Average male pot
£88,444
We have assumed the pension grows at an annual rate of 5% and that, based on our default plan, Global Leaders, annual charges are 0.70%. Average monthly contributions are based on the minimum required contribution of 8% of qualifying earnings for Auto-Enrolment. Average salaries are taken from HMRC’s national statistics on the distribution of income, and it is assumed that individuals will receive a 2% salary increase per year. Inflation reduces the rate of return. All calculations are based on the average age for the entire group, and it is assumed that the retirement age is 66.
Average pension pot size at 66
7%
Have invested in a responsible plan