This article was last updated on 16/10/2024
It’s our mission to build pension confidence and create a world where everyone can enjoy a happy retirement. This month, we’ve made significant updates to our plan information to help you better understand your pension.
Your Annual Statement is ready!
Have you seen your annual statement for the 2023/24 tax year? You can find it by logging into your account otherwise known as your “BeeHive”, clicking on ‘Account’ and then clicking on the ‘Resources’ tab. Your Annual Statement includes your current pension savings, projected retirement income and your annual management fee. You can read, download and save your statement straight from your BeeHive.
If you have any questions, please reach out to your BeeKeeper.
Keep reading to find out about this month’s product updates.
Fund performance chart and table
We’ve introduced two new plan performance graphs in our customers’ BeeHives’. These changes are designed to give you a better understanding of how our plans work. This way you can have greater confidence the plan you’re invested in works best for you. You can check them out today by logging into your BeeHive online, selecting ‘Account’ and then ‘My Plan’ or in the app by tapping ‘Account’ then ‘Plan information’
How pension investments work
Both the performance chart and table show how the fund your pension is invested in has grown over time. However, each provides a different way to understand that performance. Before explaining what the chart shows, let’s take a moment to look at how investing your money works.
Like all pensions, when you invest in one of our plans your money’s used to buy units in it. If you own 100 units in your plan and each unit is worth £1.25, then your pension balance is _lower_earnings_limit. However, the unit price changes daily and reflects your plan’s performance and value on that day.
The unit price itself is made up of the value of the underlying company shares in your plan. For example, if your plan invests in an index which includes Apple and the value of Apple falls, this impacts the unit price of the plan. So, if the unit price drops to £1.10 and you have 100 units, your pension balance becomes £110. Unit prices go up and down, and reflect how the market is doing on any given day. Essentially, if the value of the companies in your plan goes up or down, the units your money’s invested in also go up or down and as a result, the value of your pension balance will reflect this.
The fund performance chart
The chart shows what would have happened to _money_purchase_annual_allowance if you invested that money in one of our plans five years ago. As you interact with the performance chart, you’re seeing how much the initial _money_purchase_annual_allowance worth of units was worth at that point in time.
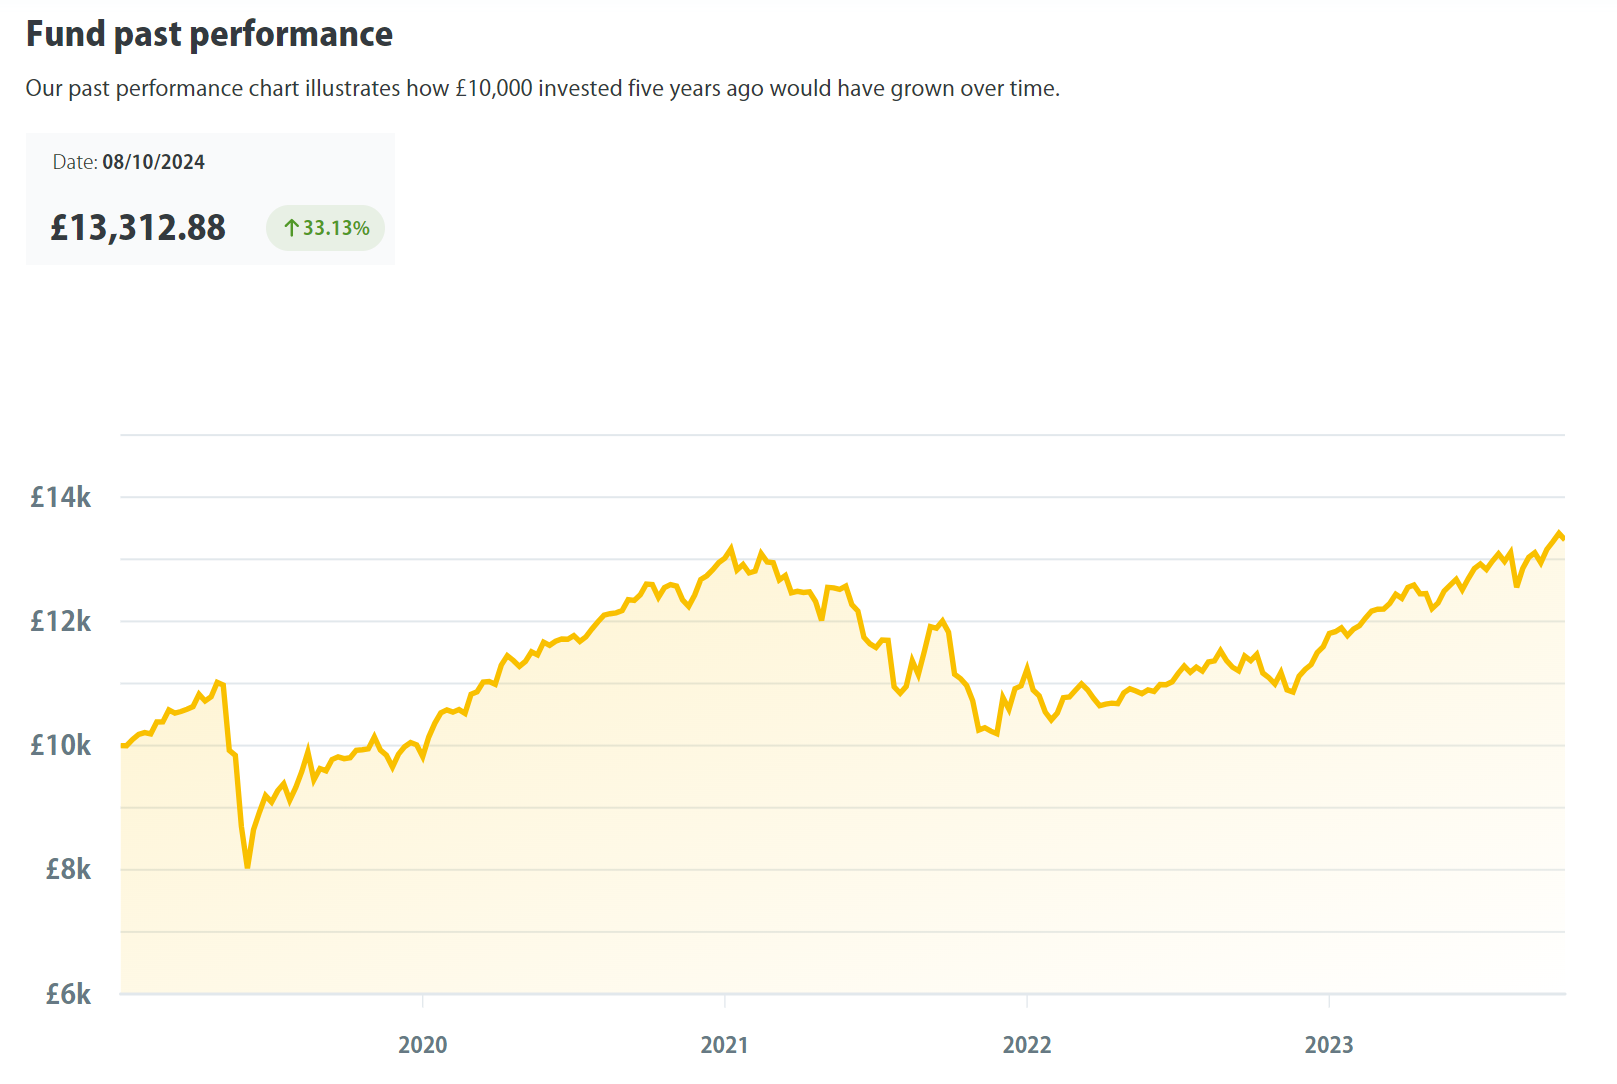
The time frame covers five consecutive 12-month periods. These run to the end of the most recent quarter of the year. As time goes on, the chart will update to show performance information to the end of the recent quarter when that data becomes available.
What’s included in the fund performance?
It’s important to note that the fund value shown may include embedded fund fees that are part of the plan’s annual management fee. These are costs paid to the fund manager to invest your money and manage the fund. The fund value excludes any personal contributions or government top ups made to your pension.
How does the chart work?
You can hover your cursor over the chart to see the value of a fund at different points in time over the past five years. As you move across it, the date, fund value and percentage will automatically update.
The fund performance table
This table gives a simple percentage of how much the fund made or lost in a given calendar year. The figures shown are after any fund charges and taxes have already been deducted. This enables you to compare the fund’s performance to any years before or after.

Please note, there’s limited historical data for our Impact Plan or our Fossil Fuel Free Plan due to when these plans launched and the available data.
Benefits of performance information
Increased confidence
We’ve made important information about our funds’ performance more accessible to help you understand the impact on your pension balance.
Past performance isn’t an indicator of future performance. However, seeing how a fund’s performed historically may offer insight into how it could perform in future. Showing performance over a five-year period should be long enough to see how the fund performed throughout different market conditions.
Performance and your plan’s objective
Different pension plans have different investment objectives. It’s important to remember that a plan’s performance shouldn’t simply be compared to other plans but also to its own objectives. For example, the objective of our Preserve Plan is to preserve the value of your pension balance rather than grow it. It may be most suitable for anyone approaching retirement and planning to make substantial withdrawals from their pension in the near future. It aims to preserve your money by investing in assets like bonds which are lower-risk but are also expected to return less compared to assets like equities. This means this plan’s growth at one point in time may have been less than a plan that invests with a different objective. Whilst the Preserve Plan may still see growth, that’s not its main objective.
Where to find the plan performance information
You can find the performance chart in our app or by logging into your account through our website. When logging in online click on ‘Account’ then ‘My Plan’ or through the app by tapping ‘Account’ then ‘Plan information’. To see the performance chart for our other plans, scroll to the bottom of your plan page and select ‘View plans’ then ‘Plan info’.
Let us know what you think
We want to continue improving our plan information where possible to empower our customers to invest in a pension that’s right for them. This year, we’ll be tackling other aspects of our plans information to make it easier to find key details and understand what they mean. If you have any thoughts about our latest changes or ways we can improve the rest of our plan pages, we’d love to hear from you. Let us know what you think by emailing [email protected].
Future product news
Keep your eye out for our next product blog or catch up on previous posts. We’re looking forward to spotlighting more of our handy features and free financial tools plus we’ve got lots of great new updates in the works we’re looking forward to bringing you this year. We’ll let you know what they are, how they can help you save for a happy retirement and how to get started.
Risk warning
As always with investments, your capital is at risk. The value of your investment can go down as well as up, and you may get back less than you invest. This information should not be regarded as financial advice.
Period | Market Event | FTSE World TR GBP (%) | 4Plus Plan (%) |
|---|---|---|---|
4Plus Plan’s inception – 6 Sept 2013 | QE Tapering, China Interbank Crisis and its aftermath | -5.44 | -2.41 |
3 Oct 2014 – 15 May 2015 | Oil price drop, Eurozone deflation fears & Greek election outcome | -5.87 | -1.77 |
7 Jan 2016 – 14 Mar 2016 | China’s currency policy turmoil, collapse in oil prices and weak US activity | -7.26 | -1.54 |
15 June 2016 – 30 June 2016 | BREXIT referendum | -2.05 | -1.07 |